Your inference provider sucks (at caching)
Originally published as an article on X.
I used to believe that if two providers serve the same model, token prices would tell you which one is cheaper. Alas, I found this relationship is shaky at best.
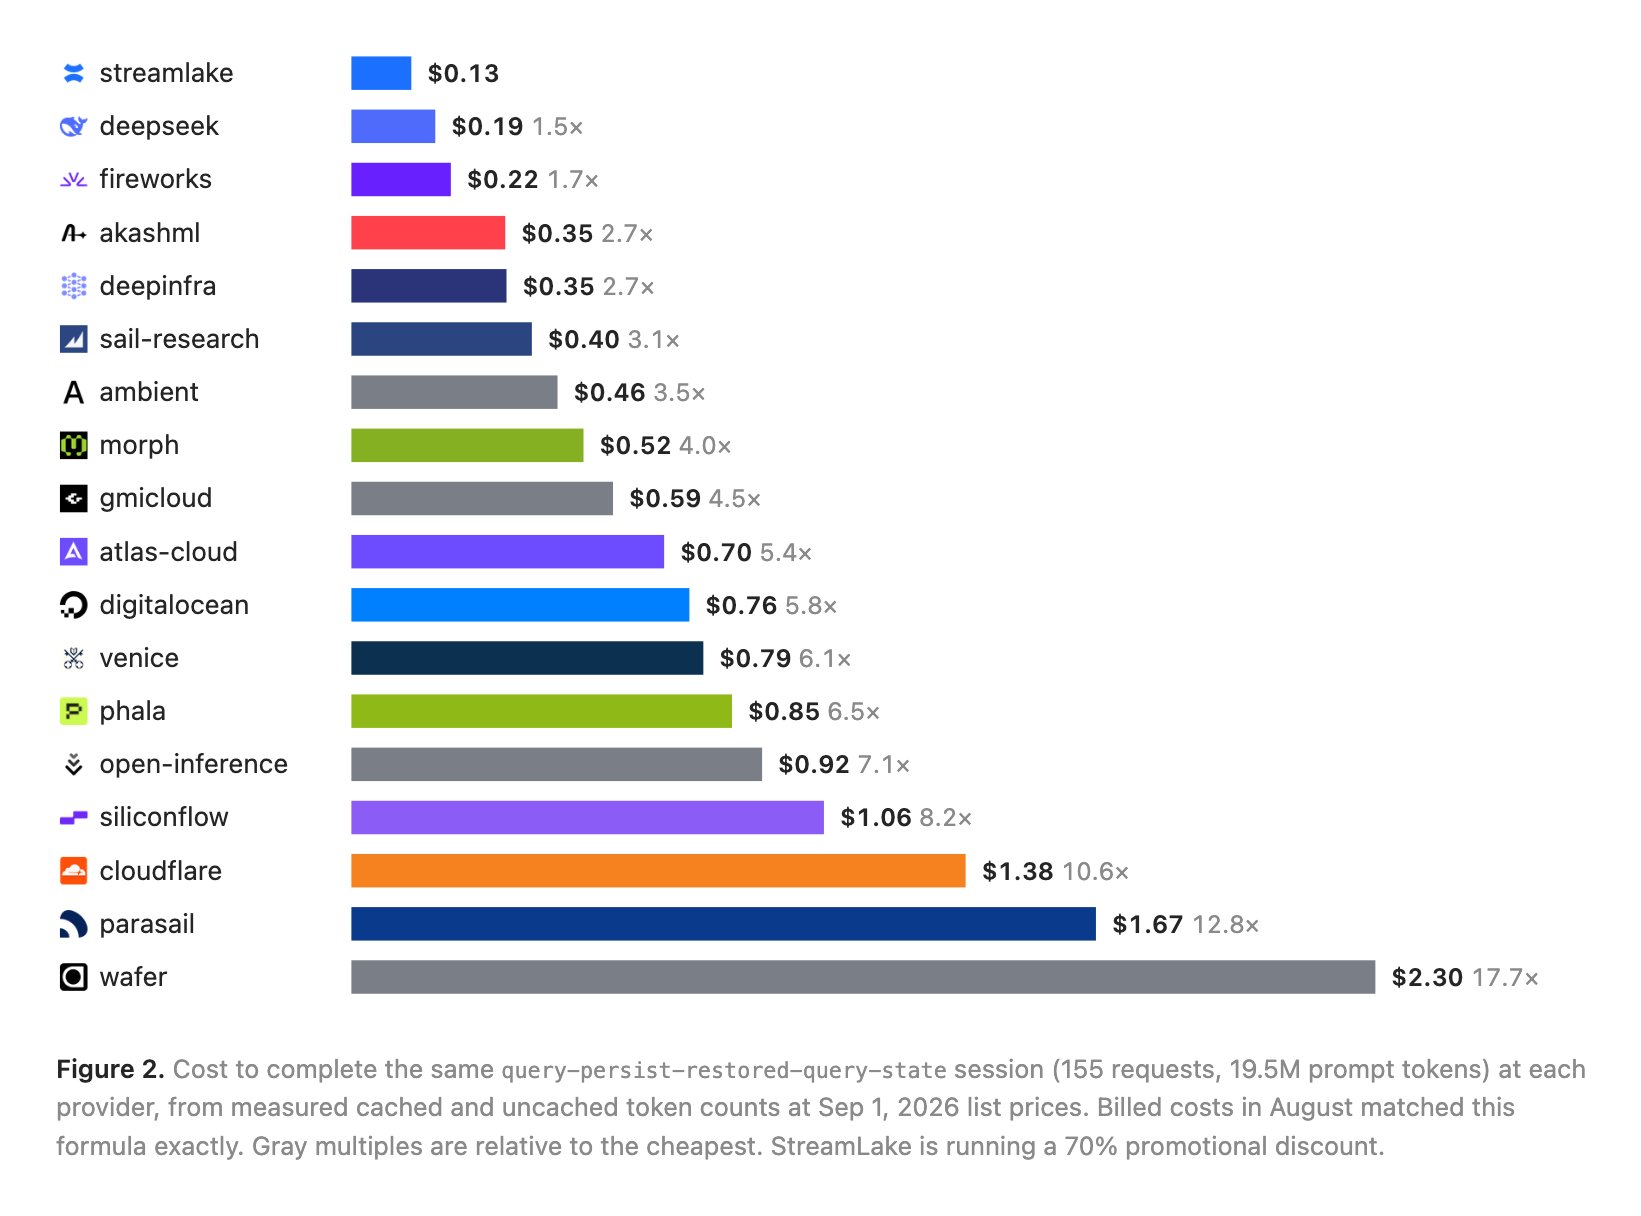
I replayed the same coding session across every DeepSeek V4 Flash provider. The cost ranged from $0.13 to $2.30. DeepSeek's official provider ranks 21st out of 30 by token price, yet was the 2nd cheapest in practice.
The reason: cache hit rates.
My benchmark is a recorded agent session solving query-persist-restored-query-state from Datacurve's DeepSWE benchmark. The run makes 155 API calls, sends 19.5M prompt tokens, and generates only 60k output tokens.
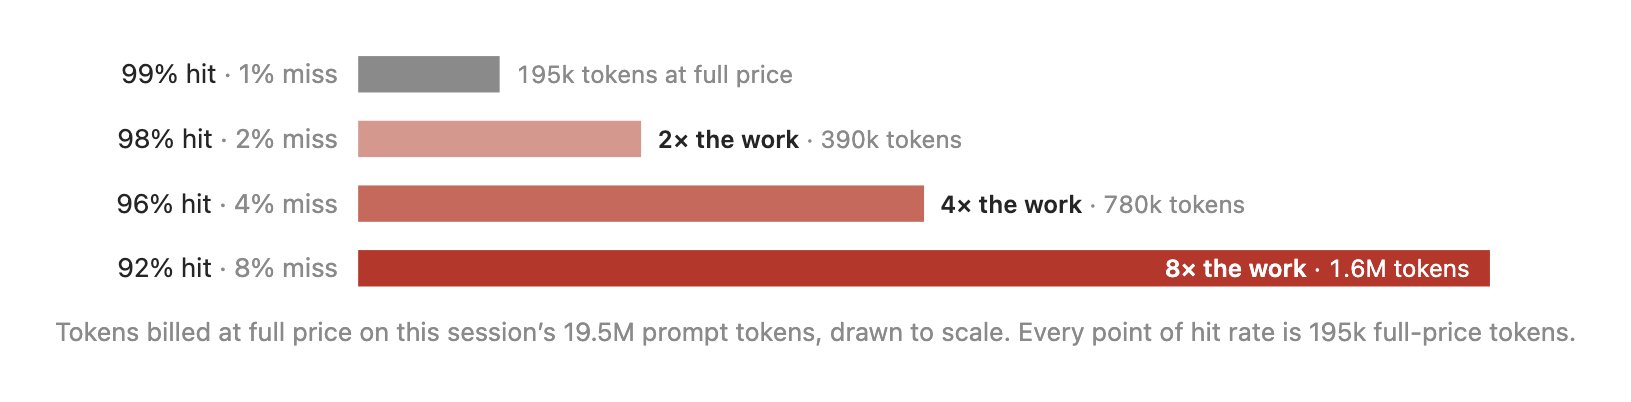
Cached prompt tokens are an order of magnitude cheaper than uncached ones. So for this kind of workload, cache hit rate is analogous to cost.
And differences can be deceivingly small:
You might turn to OpenRouter's cache hit-rate data to gauge which providers cache well.
Unfortunately, that number is averaged over each provider's own production traffic. A provider serving mostly one-shot chats can look terrible even if its cache works perfectly for agents. And the number moves as its customer mix changes. Between August 16 and September 1, published rates for the same providers moved by as much as 47 percentage points (ambient 82% to 35%, parasail 4% to 51%, atlas-cloud 85% to 39%).
Providers themselves document almost none of this.
OpenRouter's routing modes do not solve the problem either. Floor routes by list price, which ignores caching. Nitro routes by decode speed, which matters much less when almost every token is a resent prompt.
I couldn't find any benchmark covering how cache hit rates affect pricing so I made one.
The task
DeepSWE is Datacurve's 113-task agentic coding benchmark (datacurve-ai/deep-swe): real feature requests against real repositories, graded using held-out tests.
Earlier, I recorded a mini-swe-agent run that solved query-persist-restored-query-state, a persistence feature in TanStack Query. The agent took 155 steps: reading files, editing code, and running tests.
A solved run of a real task makes a good probe because it is exactly the prefix-heavy workload prompt caches are designed for. And because I replay the recording, every provider gets the exact same workload.
Measurement
I reconstructed the session into its exact request sequence.
Request k is the full conversation immediately before assistant turn k: same messages, same tool schema, same sampling settings.
Every provider receives the exact same bytes at the session's original pacing. I pin requests using OpenRouter's provider.only, disable fallbacks, and verify the served-provider field on every response.
Generation is capped at one token (max_tokens=1). Caching depends on the input, and the agent's original replies are already included in the conversation, so generating them again would only add noise and cost.
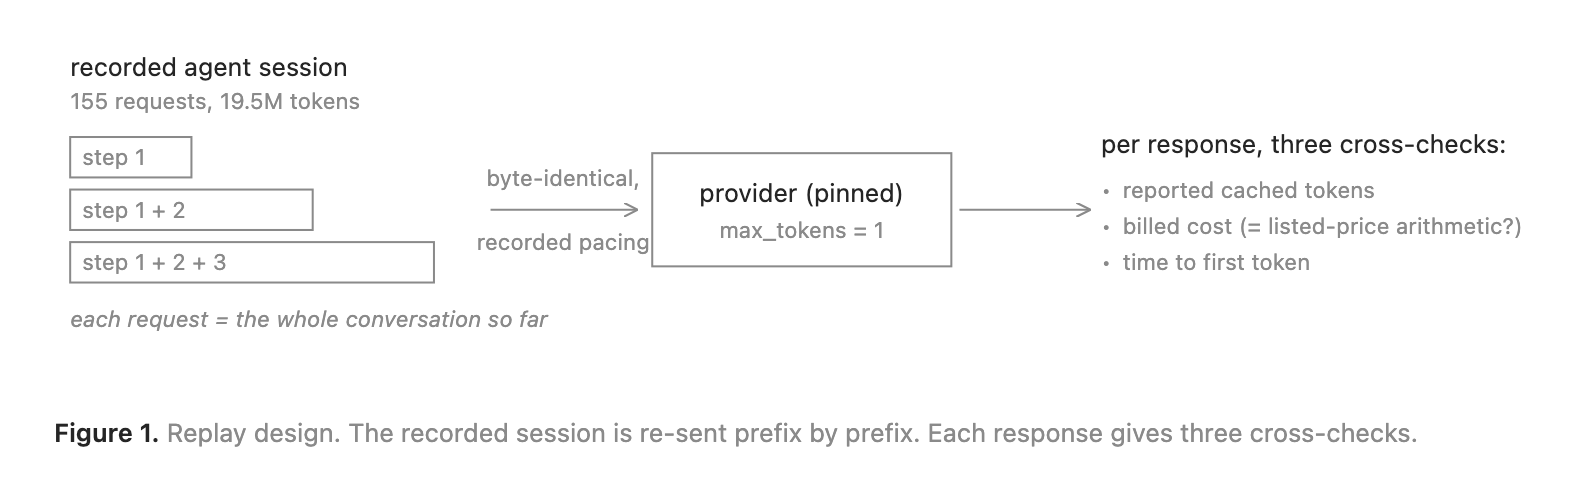
I used a replay instead of running the agent live because live runs diverge. This way cache behavior becomes the isolated variable.
So how do the costs compare?
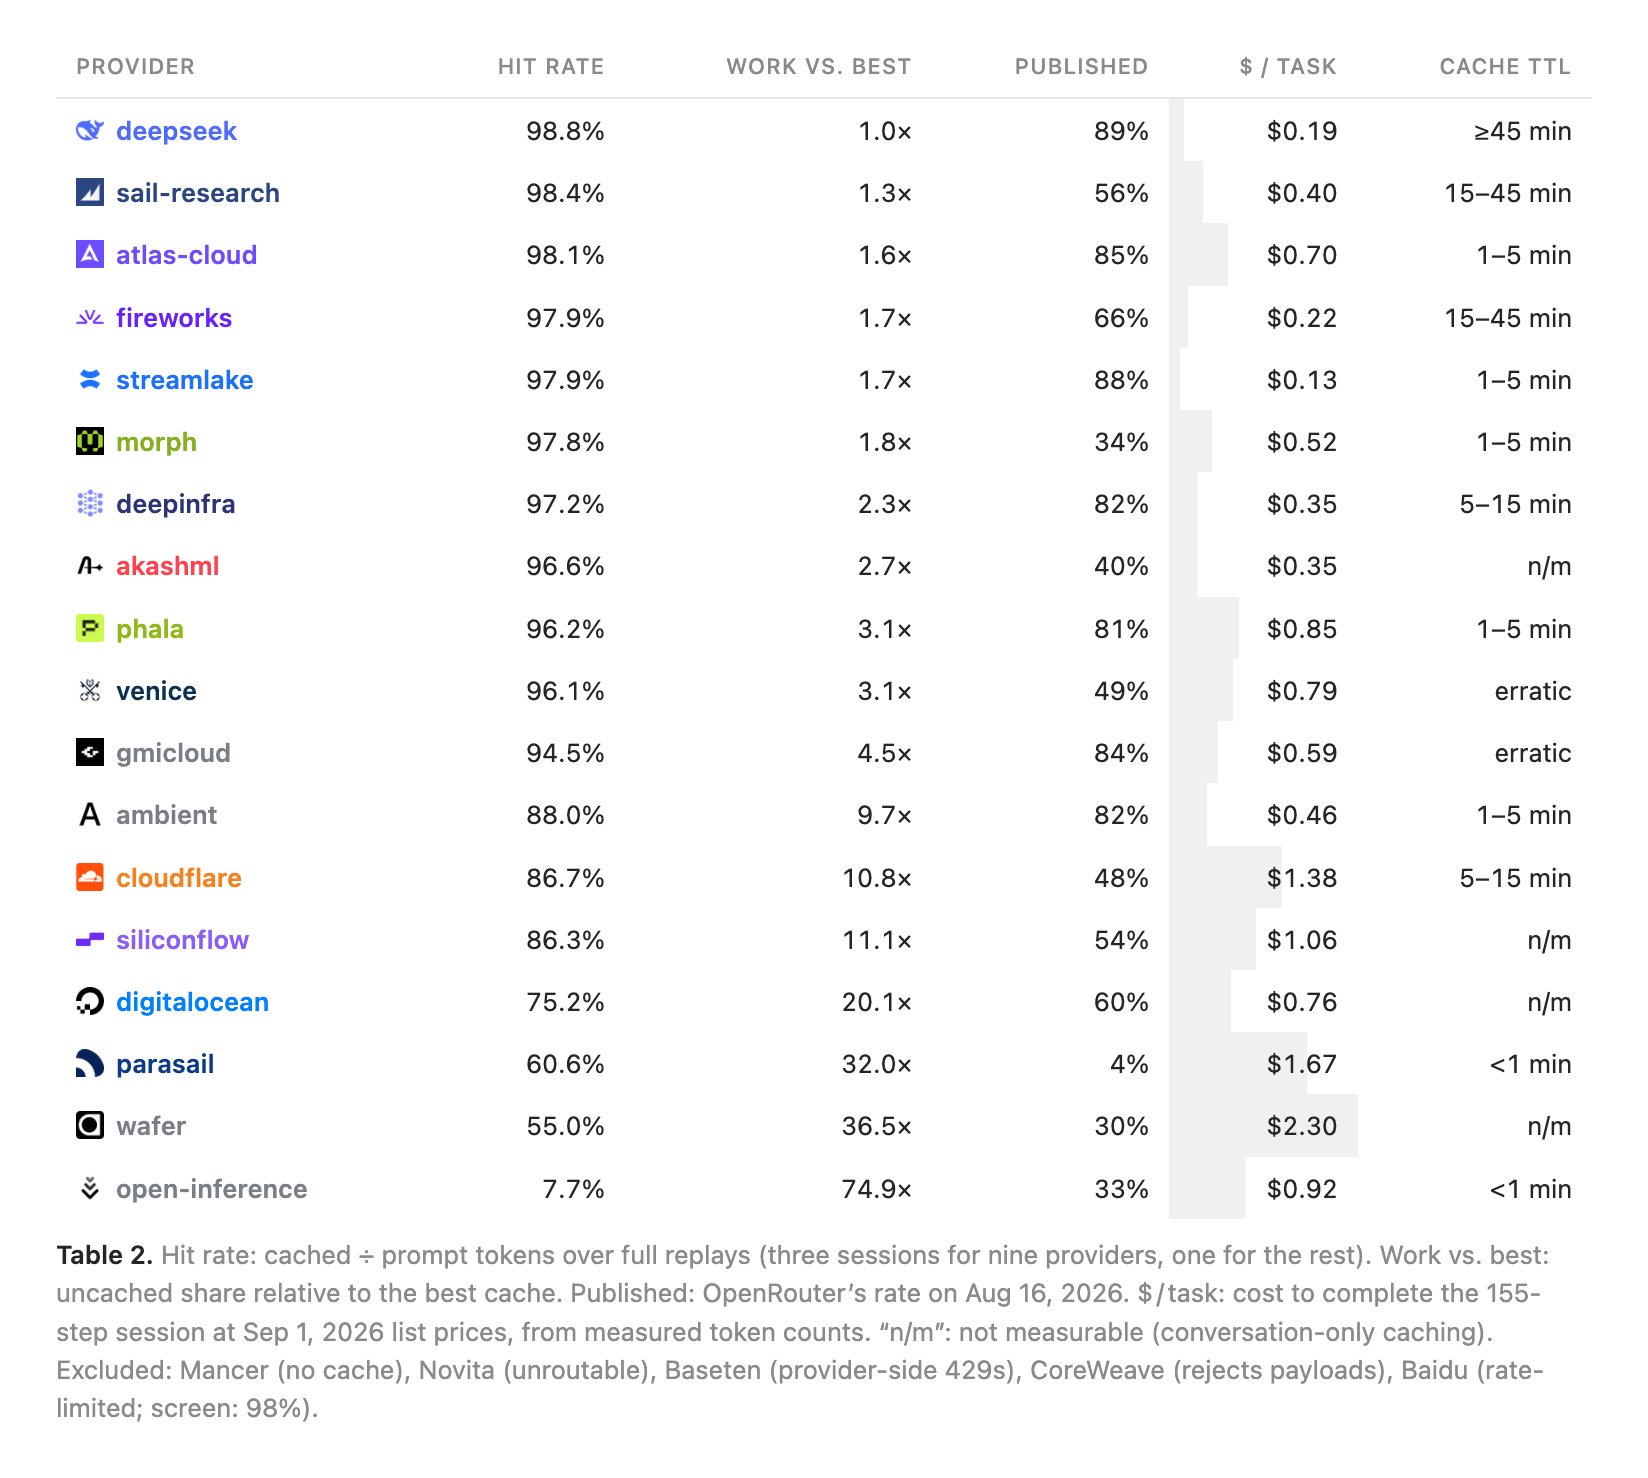
One task, $0.13 or $2.30
Running query-persist-restored-query-state costs $0.13 at StreamLake and $2.30 at Wafer at today's prices.
Same requests. Same tokens. 17.7× difference.
List price predicts surprisingly little.
DeepSeek ranks 21st of 30 by list price but finishes 2nd cheapest in practice, because almost everything it serves gets billed at its $0.007-per-million cache-read price.
Several supposedly cheap endpoints have weak caches. Their low token price applies to dramatically more full-price tokens.
And a good cache does not necessarily mean a low bill. Atlas Cloud caches about 98% of the session but still lands near the middle because its list price tripled in August.
So where does the 17.7× spread come from?
The Caching Champions
Most of the cost spread comes from one thing: cache hit rate.
Eleven of the eighteen measurable providers cached 94–99% of the session, close to the theoretical 98.8% ceiling. Each request contains a newly added suffix, so 100% is impossible.
The tail is not as performant with Parasail at 61%, Wafer at 55%, and OpenInference at 8%.
OpenRouter's published numbers rank providers very differently.
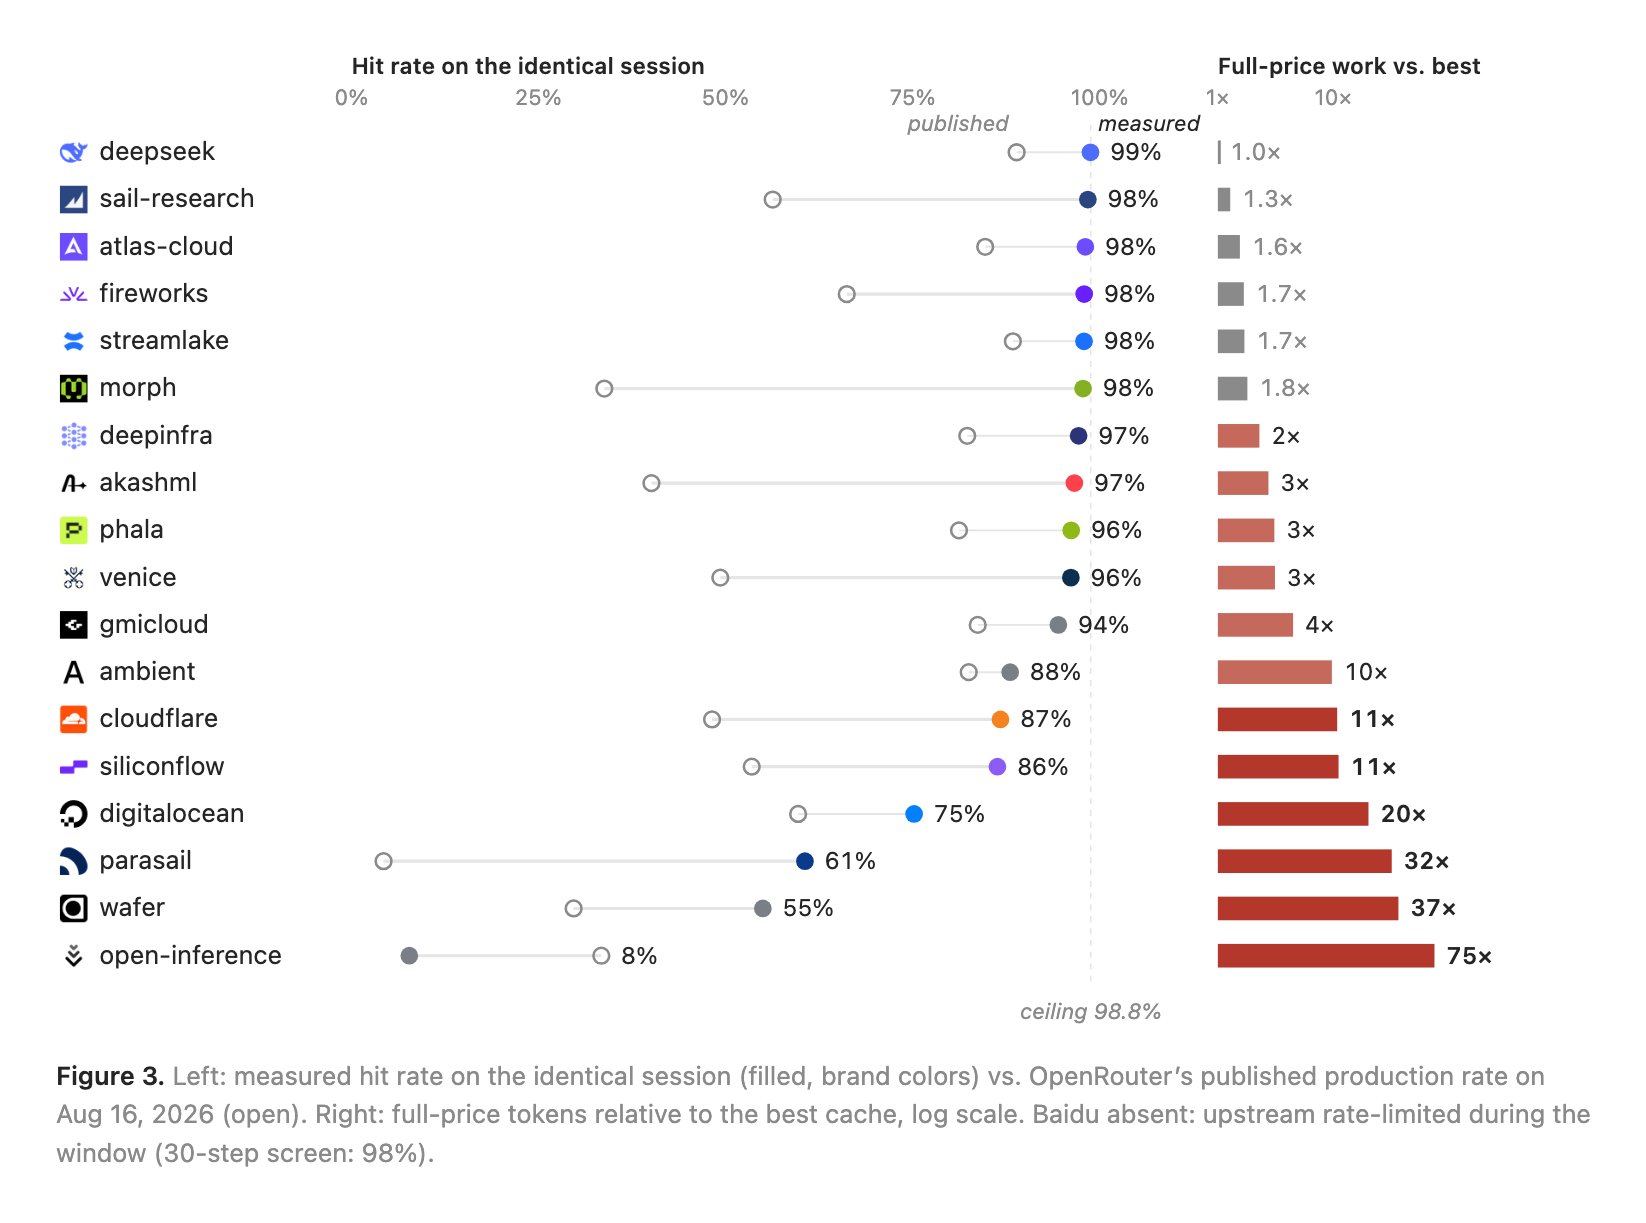
On the day of measurement, the rank correlation between published and measured hit rates was only 0.62. Against the September 1 published column, it falls to 0.27.
Fireworks, Venice, Sail Research, and Morph all delivered near-perfect caches while their published rates were 30–64 points lower.
The published number mostly tells you about the provider's customers.
It does not reliably tell you how well the provider will cache your agent session.
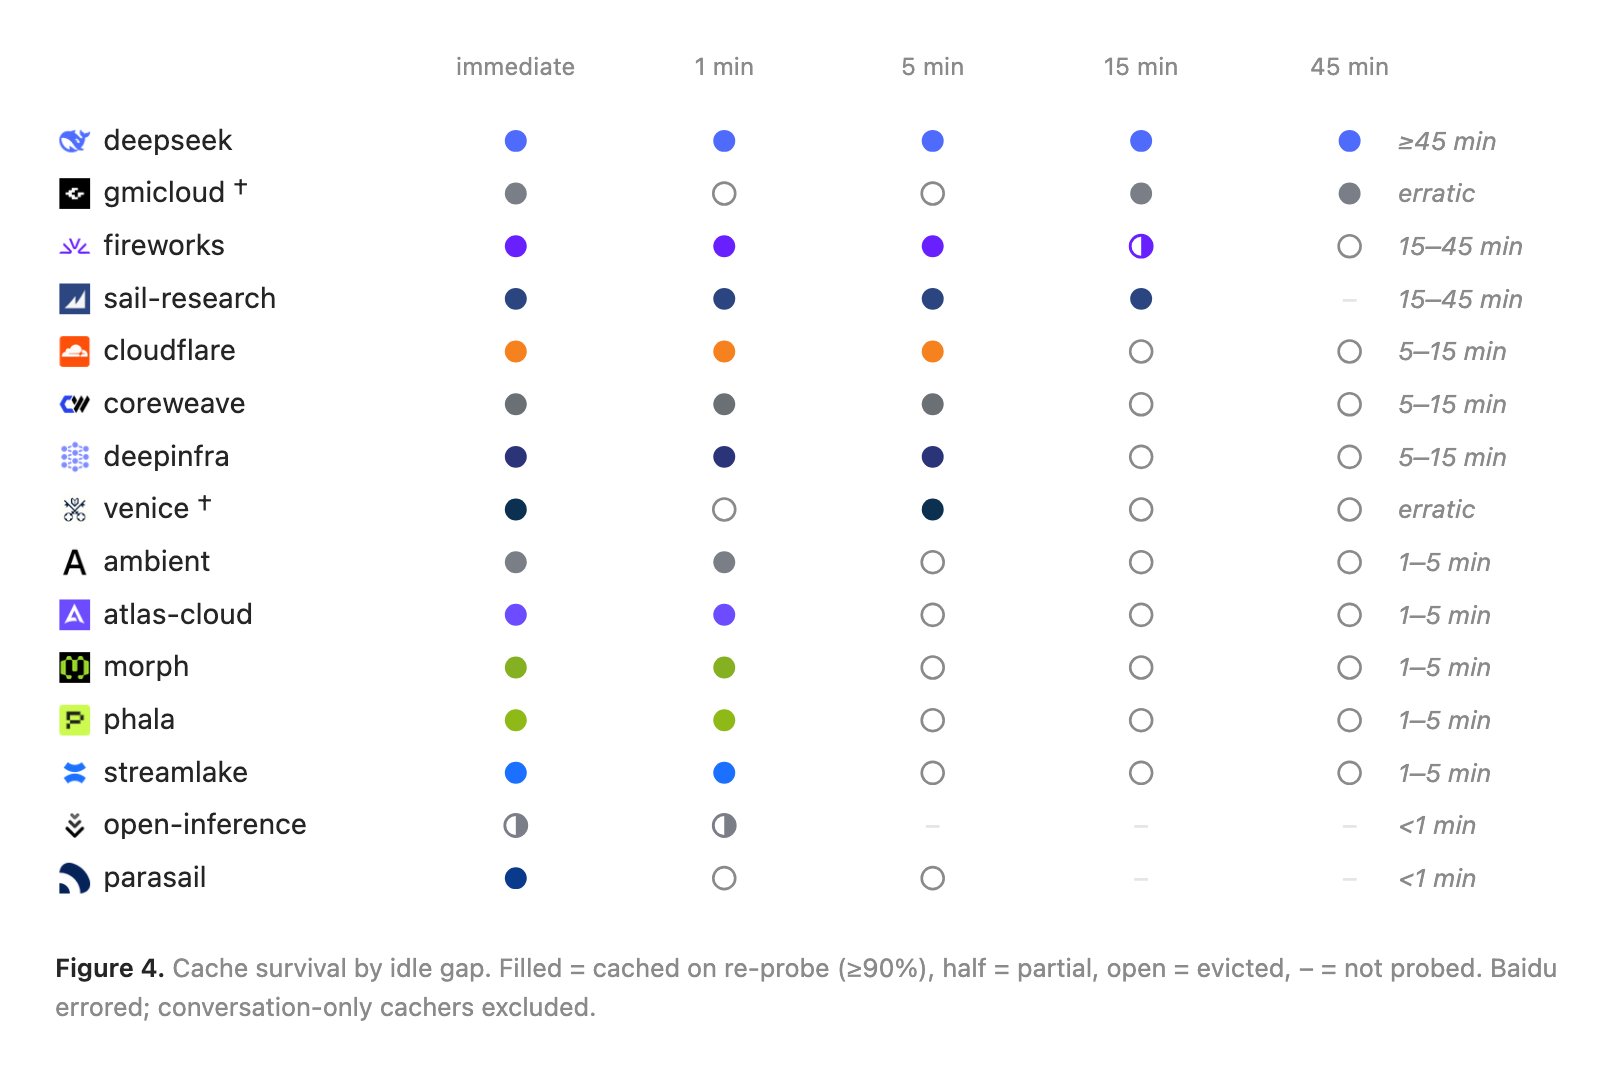
How long caches survive
A cache only helps if it survives the gap between requests.
The recorded agent session had a median pause of 6 seconds, 6 pauses over 30 seconds, and a maximum pause of 38 seconds.
Every cache tested could handle that.
But we often pause much longer. You read the output, think, maybe break for lunch, then type another message several minutes later.
I warmed a unique 30k-token prefix, waited increasingly long idle periods, and then sent it again.
Most providers evicted the cache within 1–15 minutes.
DeepSeek was the only provider still warm after 45 minutes.
GMICloud and Venice produced contradictory hit/miss sequences, which looks like requests being load-balanced across replicas without reliable prefix affinity.
DigitalOcean, AkashML, SiliconFlow, and Wafer cached the growing conversation but never cached a resent standalone prompt, so I could not measure their lifetime using this method.
OpenRouter rankings vs. reality
OpenRouter's Floor mode ranks providers by list price. Its cache column ranks them by published production hit rate.
Neither ranking lines up particularly well with our results.
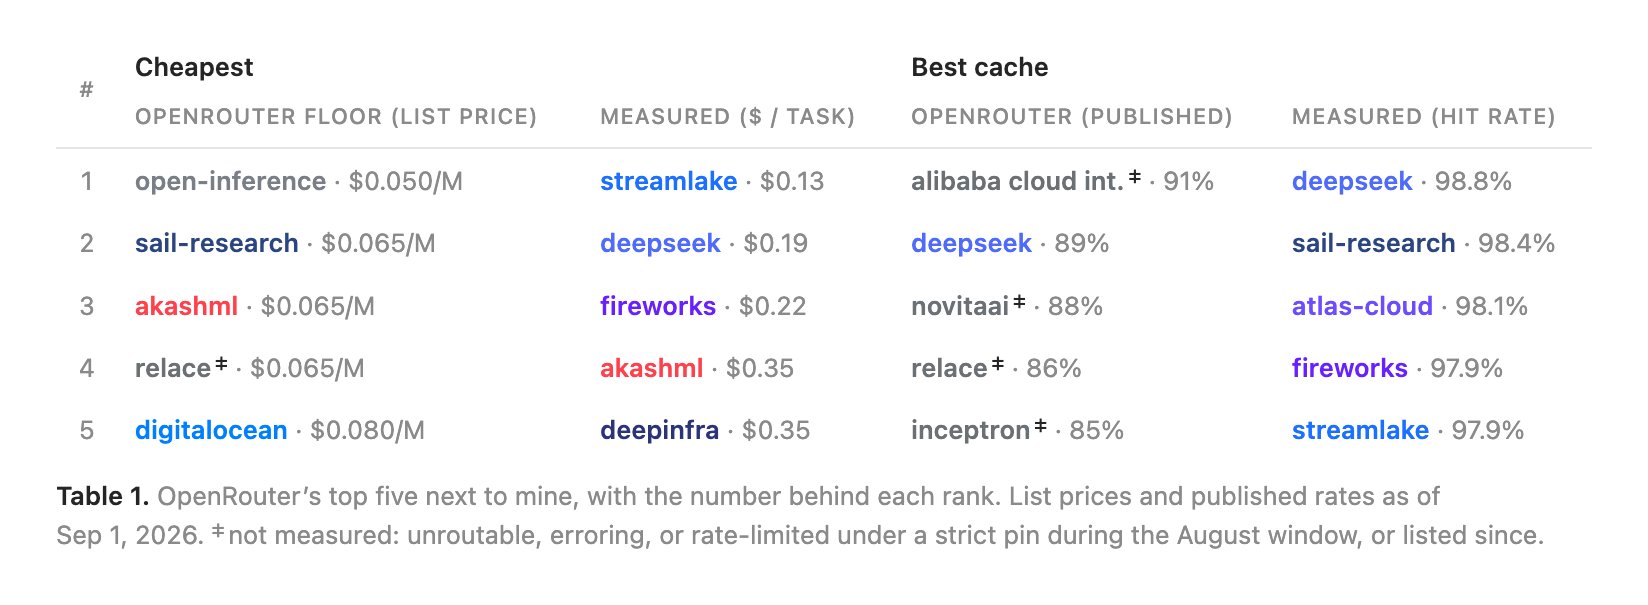
OpenRouter's cache hit-rate column correlates extremely poorly with real performance.
The problem is they route on these signals. Floor picks by list price, which ignores caching, and its top pick had the worst measured cache in the entire study.
Full results
Anomalies
Impossible cache reports. OpenInference reported 42% of a brand-new, globally unique prefix as cached on its first request. Its full replay measured only 8%, by far the worst result in the study. Its cached_tokens field appears to be disconnected from a normal prompt cache. Interestingly, billing follows the reported number, so the discrepancy currently works in the customer's favor.
Cross-account sharing. Baidu, Venice, OpenInference, DeepSeek, and GMICloud all returned 256–1,378 cached tokens on the first request of a workload I had never sent. Those tokens correspond to the mini-swe-agent system prompt, which many users send verbatim. This points to cross-account cache reuse: another user's traffic had already warmed the same prefix. The increments also suggest 256-token cache blocks.
Payload rejection. CoreWeave returned HTTP 400 on 150 of 155 requests. It rejects histories containing reasoning fields that every other provider accepted.
Limitations
This is one model, one workload shape, one OpenRouter account, and one point in time.
Everything goes through OpenRouter. Direct or BYOK traffic may behave differently. Cache behavior under heavy load may also differ from these idle probes.
The market moves fast. Several providers repriced DeepSeek V4 Flash by 20–370% during the study and changed prices again afterward. To keep the comparison consistent, every batch archives the price sheet used at the time, and the costs shown here are recalculated from measured token counts using the September 1 price sheet.
Hit rates were measured on August 17 and may have changed since.
Replay also slightly understates cache hit rates because the recorded assistant replies enter later requests without receiving normal generation-time warming.
The takeaway: list price is not enough. Cache behavior dominates the economics of heavily agentic workloads.
Future research
This study only looks at cost. The obvious next question is whether providers differ in quality too: run the full DeepSWE benchmark, all 113 tasks, against every provider serving the same weights, and compare pass rates.
My hypothesis is yes. Quantization, sampling implementations, and serving stacks differ across providers, and there is no reason to assume they all produce the same result.
Reproducibility. Per-request logs (tokens, cached tokens, billed cost, TTFT, and served provider), along with market snapshots, schemas, the replay harness, and the scripts behind every figure, are available at github.com/O1af/isometric-eval. The workload comes from Datacurve's DeepSWE benchmark, pinned at 435ee89, using mini-swe-agent 2.4.6. The recorded trajectory and verifier artifacts are published as well. Every number in this post can be derived from the raw JSONL.
Next post
The Area Over the Curve